Godox V1 Flash Duration Measured with Sekonic L-858D
Introduction
After my previous experiment with Fujifilm EF-X20 flash duration, I did a similar experiment with Godox V1. Please see the previous article for more information about flash duration.
Godox V1 technical data says the Flash Duration is between 1/300 and 1/20000 seconds.
Setup
I have fully charged the battery and mounted the Godox V1 on a small tripod. It is not connected to a camera, I use the test button to fire it.
I have the exposure meter mounted on a similar height tripod, 50cm away from the flash. I keep the luminosphere retracted, and the measurements are done in Flash Duration Analysis Cordless mode. I set the Number of Pre-flash to zero. T is set to 30, and ISO is set to 100 for all measurements.
Experiment
I measured the flash duration for t values of 0.5 and 0.1 at each output level (1/1, 1/2, 1/4, 1/8, 1/16, 1/32, 1/64, 1/128, 1/256) twice.
Results
The measurements below are given in pairs, where the first number is in seconds (like shutter speed) and the second is in microseconds.
Effective Flash Duration (t=0.5):
| Power Level | Measurement 1 | Measurement 2 |
|---|---|---|
| 1/1 | 1/1440, 695 | 1/1230, 810 |
| 1/2 | 1/1450, 691 | 1/1450, 691 |
| 1/4 | 1/3370, 297 | 1/3290, 304 |
| 1/8 | 1/6540, 153 | 1/6440, 155 |
| 1/16 | 1/12000, 83 | 1/11700, 85 |
| 1/32 | 1/22200, 45 | 1/22200, 45 |
| 1/64 | 1/34200, 29 | 1/37000 27 |
| 1/128 | 1/55600, 18 | 1/55600, 18 |
| 1/256 | Under | Under |
Total Flash Duration (t=0.1):
| Power Level | Measurement 1 | Measurement 2 |
|---|---|---|
| 1/1 | 1/413, 2420 | 1/417, 2340 |
| 1/2 | 1/1290, 774 | 1/1290, 776 |
| 1/4 | 1/2850, 351 | 1/2850, 351 |
| 1/8 | 1/4880, 205 | 1/4940, 203 |
| 1/16 | 1/8080, 124 | 1/7800, 128 |
| 1/32 | 1/12300, 81 | 1/12300, 81 |
| 1/64 | 1/17100, 58 | 1/17100 58 |
| 1/128 | 1/23400, 42 | 1/21200, 47 |
| 1/256 | 1/27800, 36 | 1/27800, 36 |
Under means the exposure meter is not able to measure this, because the duration is less than 1/55000 sec (18us) which is the lowest value it can measure.
Sekonic also shows the Flash Waveform Graph as below.
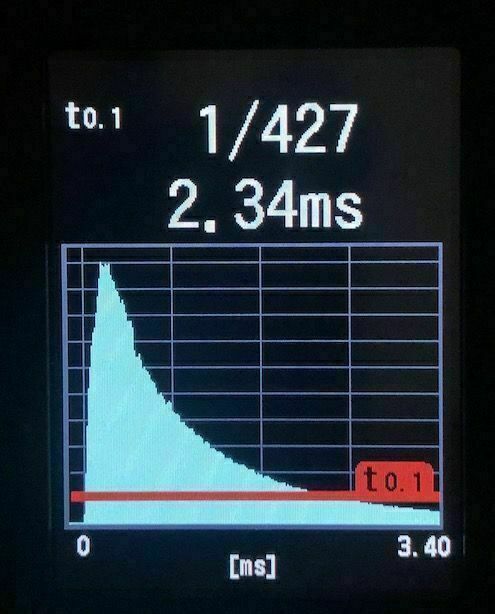
Flash Waveform at full power (1/1)
As it can be seen in the above graph, flash output goes up to full almost immediately, then gradually decreases to zero. Pay attention the horizontal axis is in milliseconds not microseconds.
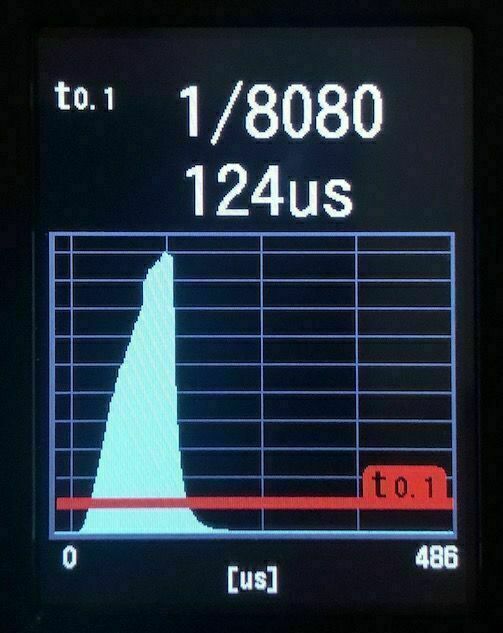
Flash Waveform at 1/16 power
When the flash output is 1/16, the flash waveform is a bit different and it ends suddently like a square wave, without a long tail like at the full output.
This work is licensed under a Creative Commons Attribution-NonCommercial-ShareAlike 4.0 International License.