Measuring the Color Rendering Quality and Aputure Amaran AL-F7 LED Light
Introduction
This post is not sponsored by Aputure or any other company, and it does not aim to provide an accurate technical report, but an example of measuring color rendering quality of a light source, particularly Aputure Amaran AL-F7 LED Light for my personal needs. The technical measurements in this post are carried out carefully but not in a laboratory environment and naturally should not be used as such.
I needed a continuous light, and almost stepless adjustment of its CCT (Correlated Color Temperature) and brightness and its affordability made it easy to buy this product. Then, I wondered if I can use this lamp for proper viewing of photographic prints (technically ISO 3663:2009 P2 condition: practical appraisal of prints), and for this I need a light source that has certain properties. AL-F7 specification on its product page tells it has CRI (Color Rendering Index) over 95, but to compare this light source to the conditions given for the ISO 3663:2009 P2 viewing condition I need more information.
Methods
Following devices and software is used for this post.
- Aputure Amaran AL-F7 LED Light, fitted with its diffuser
- Sekonic L-858D Light Meter
- X-Rite i1Studio Spectrometer
- Gray Balance Target in X-Rite ColorChecker Passport Photo 2
- spotread utility from Argyll Color Management System, running under Windows 10. spotread is used with i1Studio.
- LED ColorCalculator by OSRAM SYLVANIA, running under Windows 10. LED ColorCalculator is used with the spectral data I obtained with spotread.
- BabelColor CT&A, running under Windows 10. This software is not free but I am using it with what is available in trial mode, also with the spectral data I obtained with spotread.
Setup
AL-F7 is staying horizontally (on its long side) on my desk.
The distance between AL-F7 and the spectrometer is 12cm. This is because I am using the spectrometer in projector measurement mode, and in this mode, it is recommended to keep it 1.5x the height of the projection area. Since the LED light is 8cm height, I keep the distance as 12cm.
For luminance measurements, I use the Gray Balance Target of ColorChecker Passport, again staying 12cm from AL-F7 and I measure the luminance directly above AL-F7 with the spot measurement functionality of the light meter.
First, I want to see if I can adjust the CCT accurately. Also, since I want to use the diffuser for the actual experiment, I want to measure how diffuser affects the CCT. Also, I want to set the brightness to 80cd/m2 as measured over the gray balance card. I decided to use 80cd/m2 because the short term repeatability emissive specification of the spectrometer is given at 80cd/m2.
I first set AL-F7 CCT to 5000K and brightness to 50%, without diffuser. CCT measured by spotread is 5115K. Luminance is around 80cd/m2. So the CCT adjustment is quite accurate.
Then, I installed the diffuser on AL-F7, and measured again. CCT is now 4674K and luminance is around 20cd/m2. So the diffuser decreased CCT around 400K and luminance to its quarter.
In order to bring it back to 5000K and 80cd/m2, I played with the adjustments, and setting it to 5300K and 71% brightness gave measured CCT 5063K and 80cd/m2. This is the values I use for the color quality experiment below.
Experiment
For ISO 3663:2009, I need to measure the chromaticity of the light source (or in other words how far it is from ideal CIE illuminant D50), CRI general index (Ra) and individual CRI indices (Ri) for samples 1-8.
Below is the output from spotread when the LED light is fitted with diffuser and set to 5300K and 71% brightness. Measurement is with i1Studio from 12cm in its projector measurement mode.
Spectrum from 380.000 to 730.000 nm in 106 steps
0.263811, 0.263811, 0.263811, 0.263811, 0.263811, 0.263811,
0.263821, 0.271903, 0.290073, 0.310519, 0.415892, 0.700744,
1.25723, 2.08931, 3.30723, 5.10013, 7.8559, 12.0805,
18.2969, 26.5044, 35.3217, 42.2412, 45.2674, 43.7509,
39.3055, 34.1878, 30.0206, 26.9654, 24.6676, 23.2402,
22.8554, 23.4217, 24.5034, 25.7114, 26.9205, 27.996,
28.8684, 29.5299, 29.9263, 30.0931, 30.1025, 30.0762,
30.071, 30.0695, 30.137, 30.2645, 30.3701, 30.4707,
30.5722, 30.6849, 30.7399, 30.7237, 30.6517, 30.5231,
30.3548, 30.1653, 29.9258, 29.6376, 29.3317, 29.0195,
28.7477, 28.5596, 28.4603, 28.4164, 28.3922, 28.4602,
28.6432, 28.9096, 29.2344, 29.6074, 30.0075, 30.3847,
30.715, 30.9671, 31.1219, 31.1597, 31.0746, 30.8869,
30.6116, 30.2746, 29.8276, 29.2339, 28.4613, 27.5406,
26.5235, 25.4474, 24.3143, 23.1329, 21.904, 20.6514,
19.3929, 18.1387, 16.9151, 15.7255, 14.5842, 13.4963,
12.4599, 11.4712, 10.5366, 9.6639, 8.85519, 8.1024,
7.40439, 6.75463, 6.14619, 5.57408

 Result is XYZ: 2075.647392 2160.343355 1798.464212, D50 Lab: 307.071700 -1.642481 -1.701968
                           CCT = 5063K (Duv 0.0036)
 Closest Planckian temperature = 4951K (DE2K 5.1)
 Closest Daylight temperature  = 5053K (DE2K 0.6)
 Color Rendering Index (Ra) = 97.9 [ R9 = 98.7 ]
  R1  = 98.8  R2  = 98.9  R3  = 99.7  R4  = 97.3  R5  = 97.5  R6  = 97.0  R7  = 96.9
  R8  = 97.2  R9  = 98.7  R10 = 98.5  R11 = 99.8  R12 = 79.7  R13 = 98.8  R14 = 98.4
 Television Lighting Consistency Index 2012 (Qa) = 98.9
 IES TM-30-15 Rf = 91.19 Rg = 98.40 CCT = 5063 Duv = 0.002078
Just by looking at this output, it can be said it satisfies the ISO 3663:2009 conditions for CRI. The general index (Ra) is 97.9 (where ISO requires >=90), and the indices for 1-8 are all over 95 (where ISO requires >= 80). I think it is quite remarkable this LED light has such good CRI values. This seems to be achieved only by special purpose lamps. Aputure also tells its CRI is over 95, and here I measure it is even over 97 or so. Usually R9, which corresponds to a red sample, is low in light sources, and that is why it is specifically displayed next to Ra above, however it is no problem at all for AL-F7. The only index that is problematic is R12 which is just on the border value 80. It should be mentioned that the CRI color samples 1-8 are general, and others are special. That is why, I guess, ISO 3663 refers only to 1-8.
Now I can look into chromaticity difference. The easiest way is to use CT&A ISO 3664+ tool. I simply import the spectrum measurement values from spotread output to this tool, and I get the following chromaticity diagram:
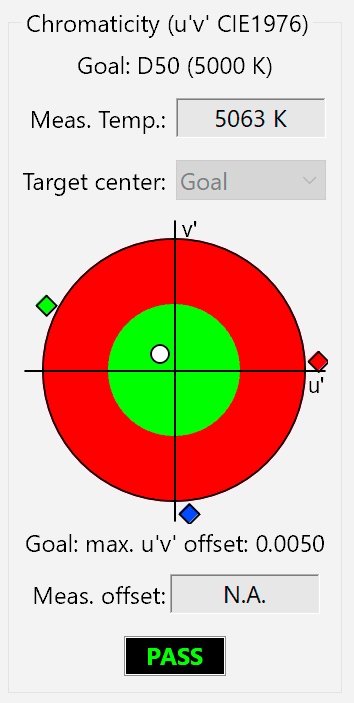
AL-F7 Chromaticity
which shows AL-F7 (white circle) is inside the chromaticity tolerance (which is 0.005, green area above) given by the ISO standard.
Now I can look into color rendering quality details with the LED ColorCalculator software which generated all the charts below. I simply import the spectrum measurement values from spotread output to this software. Below is the spectrum plot:
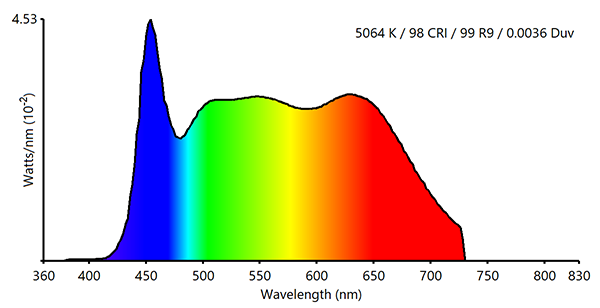
Spectrum of AL-F7
and below is the spectrum plot of the standard illuminant D50:
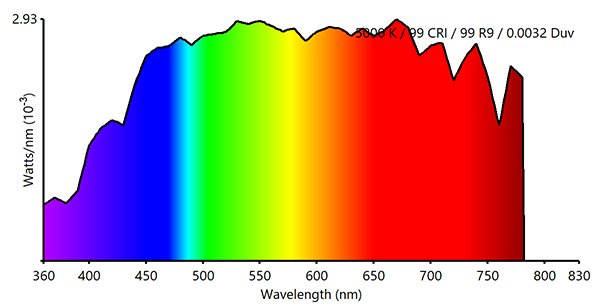
Spectrum of CIE Standard Illuminant D50
When comparing the spectrum above, you should be aware that i1Display is using M2 (UV-Cut) measurement mode and it measures from 380nm to 730nm. So, naturally, there is no information below 380 and over 730. As it can be seen here, the only major difference is on the blue section of the spectrum. This also, I think, explains the reason why R12 is low, because R12 is a blue sample. Here is the individual CRI values:
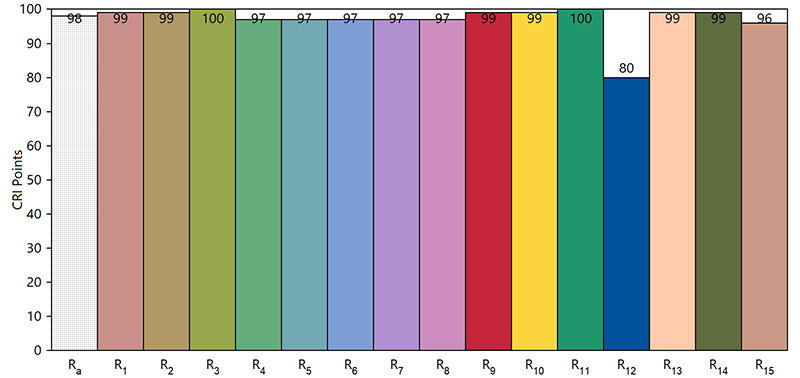
CRI points of AL-F7
and here is the difference between individual CRI colors (called TCS, Test Color Sample) and what will be seen under AL-F7 as measured by CIE Delta E 2000 color differences. You can read more about TCS here.
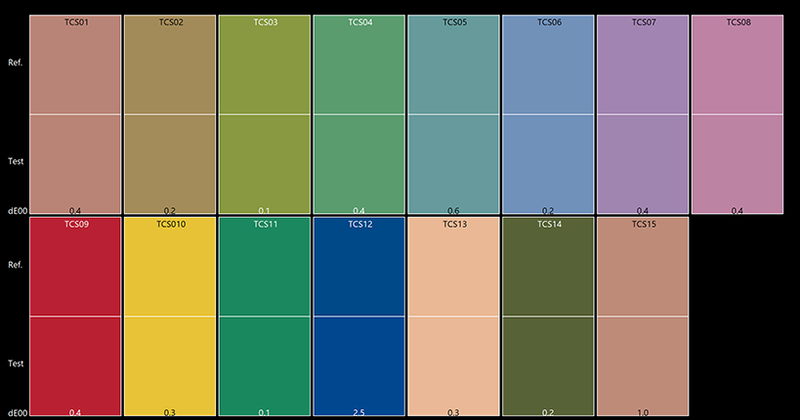
CRI Colors and delta E 2000 color differences for AL-F7
not surprisingly TCS12 (Blue) is 2.5. TCS1-14 is defined by CIE and TCS15 is added by JIS (Japanese Industrial Standards), spotread does not calculate that R15 but LED ColorCalculator does and it gives R15 as 96. So it is a bit lower than others and the difference here is shown as 1.0. When Delta E is over 1, it is said that you can differentiate the difference under critical viewing (under a good light etc.).
These values are enough for ISO 3663:2009 color rendering conditions (but there are other conditions related to illuminance and uniformity). However, in recent years, it is realized that CRI is not enough to assess the quality of color rendering of a light source, and one way to complement this is to use GAI (Gamut Area Index). You can read more about it here. This brings us IES TM-30 (IES Method for Evaluating Light Source Color Rendition). This method (and the latest is called TM-30-18 as it is published in 2018) expands CRI greatly. It has more (99 instead of 15) and better samples and measures not only fidelity (as CRI) but also gamut index and chrome/hue shifts and other things. You can read more about TM-30 here. LED ColorCalculator can be used for TM-30 as well, and it generates the report below for AL-F7:
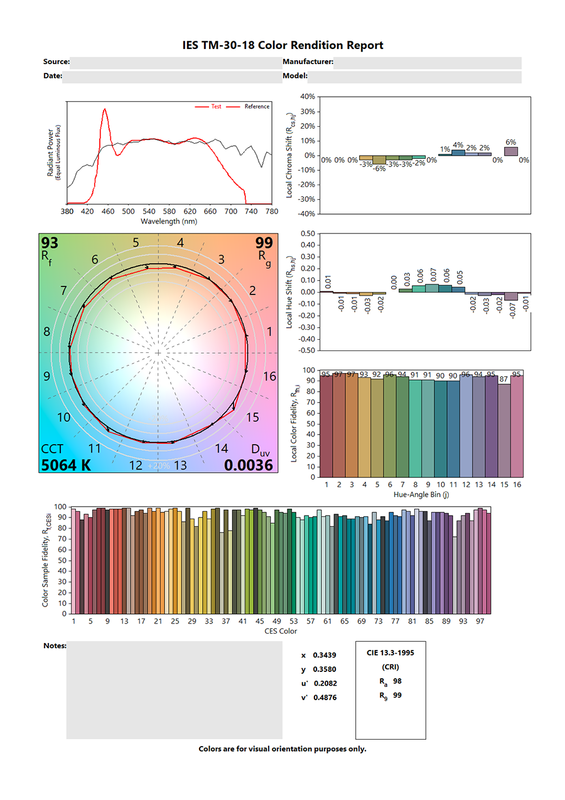
AL-F7 TM-30-18 Report
On the top left, you see the spectrum plots. Under the spectrum plots, you see color vector graphic with average Rf and Rg values. Rf is similar to CRI Ra, which measures the average fidelity of the sample colors. Rg is similar to GAI, and it measures how the reproduction of colors are different in terms of saturation. The value over 100 means more saturated. Here Rg is 99, so it is actually very similar to standard illuminant. As you can see on the charts on the right, there are some chroma and hue shifts on some particular colors and we cannot see these just by looking at the CRI measurement.
Summary
Using a similar setup, the color rendering quality of any light source can be measured very quickly. The only critical device is the spectrometer, and i1Studio is I believe the most affordable one.
Also, I think Aputure Amaran AL-F7 performs remarkable well in color rendering.
This work is licensed under a Creative Commons Attribution-NonCommercial-ShareAlike 4.0 International License.